Introduction
Diginsight is a .NET observability framework that provides automatic instrumentation for applications using OpenTelemetry.
One of its key capabilities is the automatic collection of performance and operational metrics without requiring manual instrumentation.
Diginsight automatically produces metrics such as:
- “diginsight.span_duration”: latency of a span
- “diginsight.query_cost”: RU cost of a CosmosDB query
- “diginsight.request_size”: request size of an HTTP request
- “diginsight.response_size”: response size of an HTTP request
In this article we’ll learn that:
- Diginsight collects metrics using OpenTelemetry and .NET Activity classes.
- Metrics are collected during the activity lifecycle.
- Metrics are filtered and enriched before being sent to the OpenTelemetry collector, according to the application configuration.
Table of Contents
Why Automatic Metrics Collection Matters
Manual metrics instrumentation can be:
- Time-consuming: Requires developers to add instrumentation code throughout the application.
- Error-prone: Easy to miss critical operations or add inconsistent measurements.
- Maintenance overhead: Metrics code needs to be updated as business logic changes
Diginsight solves these challenges by detecting and measuring key operations automatically, providing immediate observability insights with minimal configuration.
Understanding .NET Activities and Metrics
Diginsight’s metrics collection follows a four-step process within each metric recorder component:
- Collection: Metrics are automatically captured during .NET Activity lifecycles
- Filtering: Configurable filters determine which activities should generate metrics
- Enrichment: Additional contextual tags are added based on configuration
- Export: Processed metrics are sent to OpenTelemetry collectors
This integrated approach ensures that only meaningful metrics are sent, without noise or performance impact.
.NET Activities represent units of work in your application (HTTP requests, database queries, method calls). Diginsight hooks into the Activity lifecycle events:
- ActivityStarted: Sets up context for metric collection
- ActivityStopped: Records duration and other measurements
- Activity Tags: Provide context that becomes metric labels
This automatic hooking means metrics are captured by OpenTelemetry, for any instrumented operation, without additional code.
Metric Collection
Metrics are collected across the application flow during the .NET Activities’ lifetime.
The image below shows the SpanDurationMetricRecorder that records the diginsight.span_duration metric, at the end of an activity lifecycle.
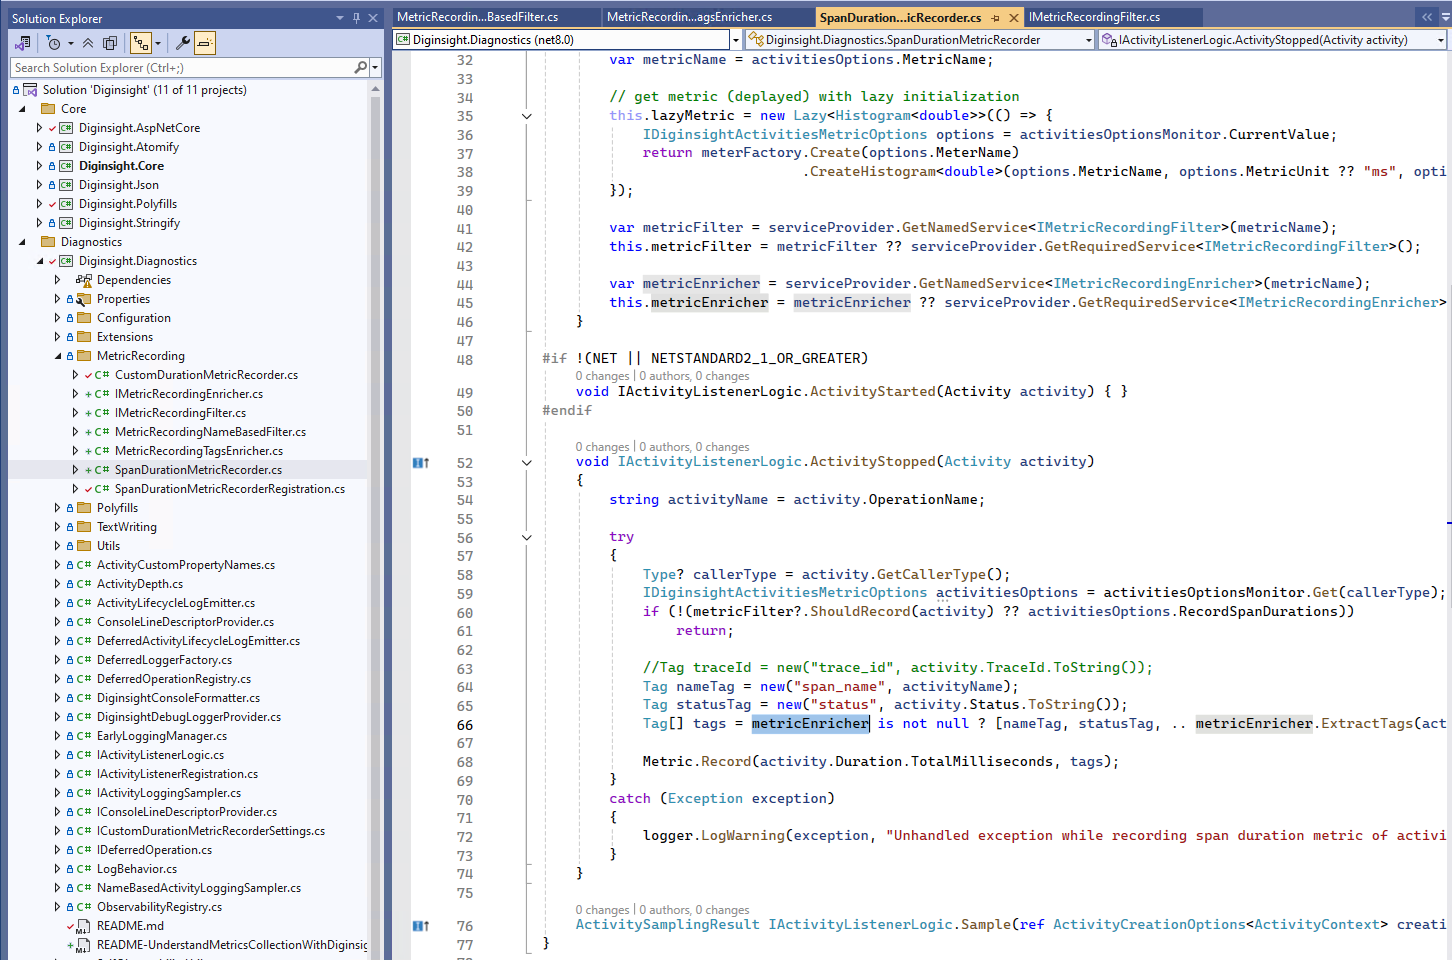
The following code shows how the SpanDurationMetricRecorder handles the end of an activity lifecycle. Notice how it:
- Checks if the metric should be recorded (filtering)
- Extracts basic tags like span name and status
- Adds enrichment tags from configuration (enrichment)
- Records the final metric with all tags
void IActivityListenerLogic.ActivityStopped(Activity activity)
{
    string activityName = activity.OperationName;

    try
    {
        Type? callerType = activity.GetCallerType();
        IDiginsightActivitiesMetricOptions activitiesOptions = activitiesOptionsMonitor.Get(callerType);
        if (!(metricFilter?.ShouldRecord(activity) ?? activitiesOptions.RecordSpanDurations))
            return;

        //Tag traceId = new("trace_id", activity.TraceId.ToString());
        Tag nameTag = new("span_name", activityName);
        Tag statusTag = new("status", activity.Status.ToString());
        Tag[] tags = metricEnricher is not null ? [nameTag, statusTag, .. metricEnricher.ExtractTags(activity)] : [nameTag, statusTag];

        Metric.Record(activity.Duration.TotalMilliseconds, tags);
    }
    catch (Exception exception)
    {
        logger.LogWarning(exception, "Unhandled exception while recording span duration metric of activity {ActivityName}", activityName);
    }
}
The metric is only recorded if the activity is not filtered out by metricFilter?.ShouldRecord(activity).
Also, the metric is enriched with a set of tags such as span_name and status, and possibly additional tags extracted by metricEnricher.ExtractTags(activity).
Similar logic happens when recording the query_cost, request_size, and response_size metrics.
Metric Filtering and Tag Enrichment
Filtering and enrichment are carried out by means of two services:
MetricRecordingNameBasedFilter: with metricFilter?.ShouldRecord(activity), it decides whether a specific activity should emit the span_duration metricMetricRecordingTagsEnricher: with metricEnricher.ExtractTags(activity), it enriches the activity with tags according to the application configuration.
MetricRecordingNameBasedFilter service
MetricRecordingNameBasedFilter filters activities based on their names, normally from a section such as Diginsight:Activities:SpanMeasuredActivityNames.
SpanMeasuredActivityNames can be empty, meaning that all activities are recorded, or it can contain a list of activity names to be recorded.
"Diginsight": {
  "Activities": {
    "SpanMeasuredActivityNames": {
    },
    "MetricSpecificSpanMeasuredActivityNames": [
      {
        "MetricName": "diginsight.span_duration",
        "ActivityNames": {
        }
      },
      {
        "MetricName": "diginsight.query_cost",
        "ActivityNames": {
          "CosmosDbExtensions.GetItemLinqQueryableObservable": true
        }
      }
    ],
  }
}
MetricSpecificSpanMeasuredActivityNames allows you to specify activities for specific metrics, such as diginsight.span_duration and diginsight.query_cost.
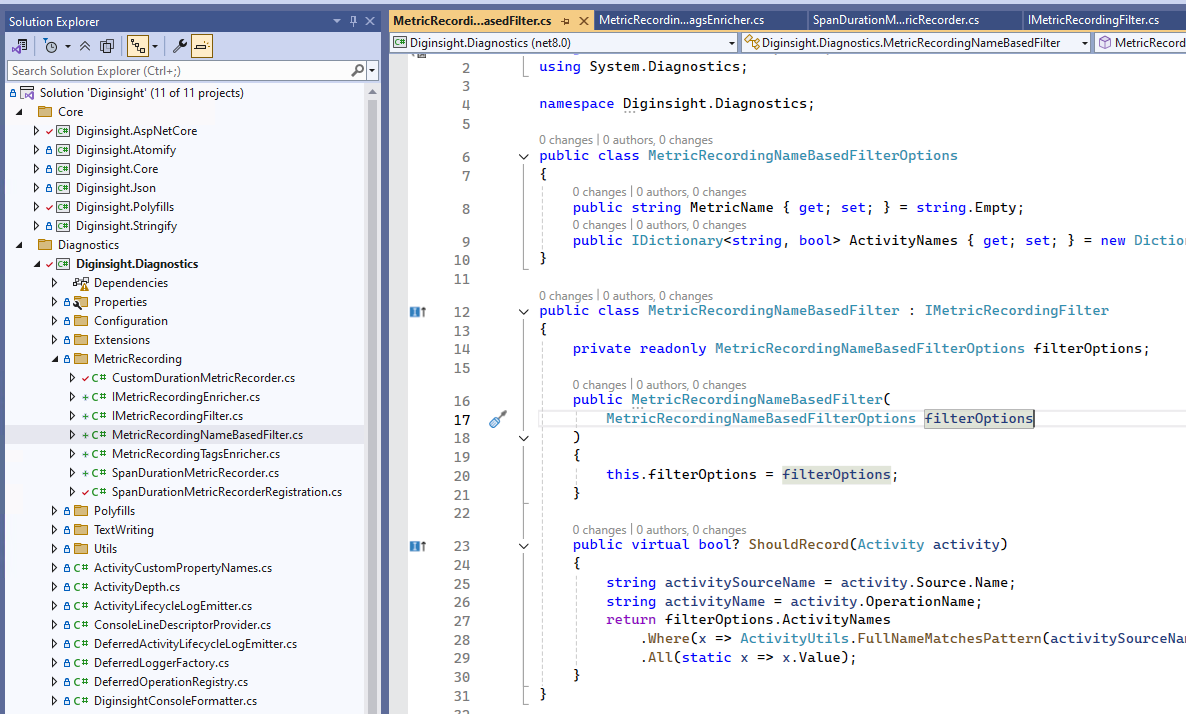
The image below shows the MetricRecordingNameBasedFilter implementation, which receives enabled activities by means of a MetricRecordingNameBasedFilterOptions structure that is initialized in the startup sequence.
MetricRecordingTagsEnricher service
MetricRecordingTagsEnricher adds tags to the generated metrics, normally from a section such as Diginsight:Activities:MetricTags.
"Diginsight": {
  "Activities": {
    "MetricTags": [
      "category_name",
      "plant_id",
      "plant_type",
      "plant_name",
      "plant_company",
      "device_type",
      "user_company"
    ],
    "MetricSpecificTags": [
      {
        "MetricName": "diginsight.span_duration",
        "MetricTags": [
        ]
      },
      {
        "MetricName": "diginsight.query_cost",
        "MetricTags": [ "database", "application_name" ]
      }
    ]
  }
}
MetricSpecificTags allows you to specify additional tags for specific metrics, such as diginsight.span_duration and diginsight.query_cost.
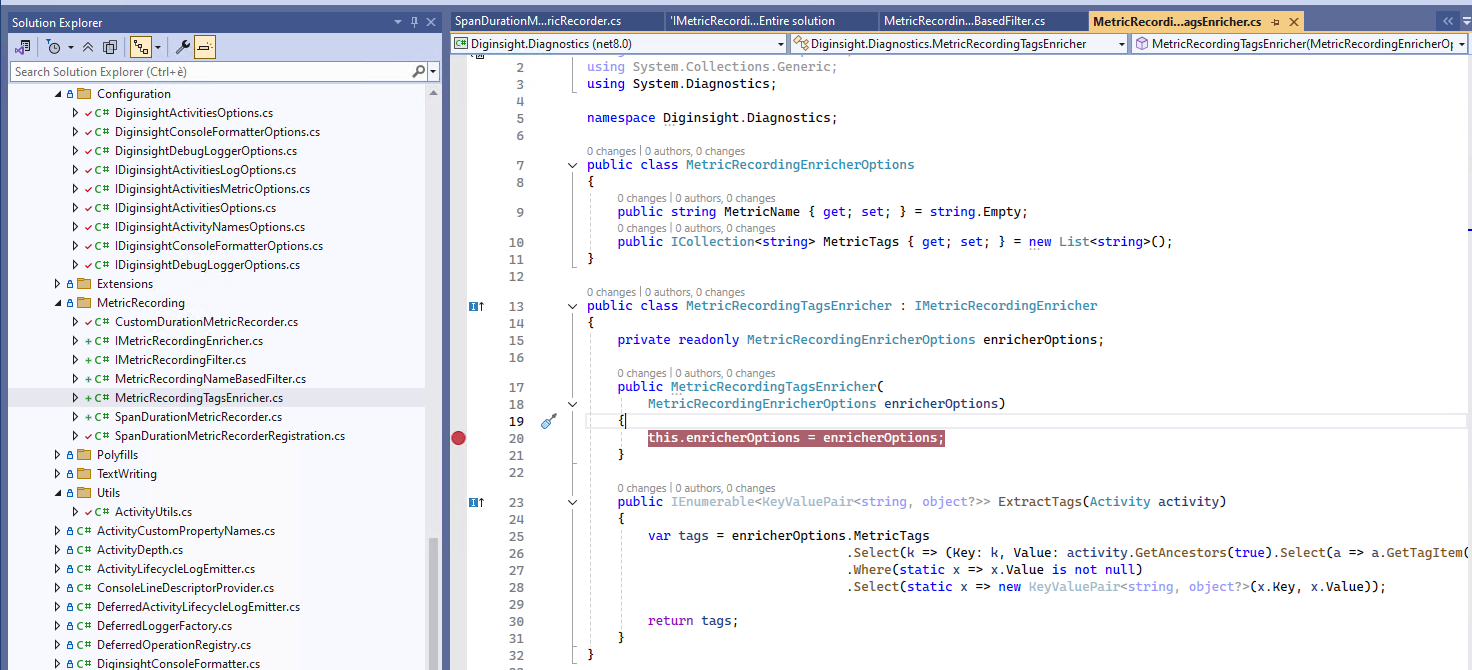
The image below shows the MetricRecordingTagsEnricher implementation, which receives the configured tags by means of a MetricRecordingTagsEnricherOptions structure that is initialized in the startup sequence.
Adding tags to a metric allows to filter and group metrics in the OpenTelemetry collector, for example by plant_name, plant_id, category_name, etc. > TODO: show query splitting cost by plant_name
For the example case of diginsight.query_cost, the tag database is added to the metric values to allow splitting the query-generated cost for each database.
TODO: show query splitting cost by database or by application_name
Startup Sequence Configuration
The MetricRecordingNameBasedFilter and MetricRecordingTagsEnricher services are configured in the startup sequence, as shown in the code snippet below.
In particular, SpanMeasuredActivityNames, MetricSpecificSpanMeasuredActivityNames, MetricTags, and MetricSpecificTags are read from the configuration.
Then, for any of the supported metrics, a named configuration is created (for example, diginsight.span_duration, diginsight.query_cost, etc.), and a named singleton is registered with the associated configuration.
if (openTelemetryOptions.EnableMetrics)
{
    var diginsightConfig = configuration.GetSection(ConfigurationPath.Combine(diginsightConfKey, "Activities"));

    var defaultMetricActivities = diginsightConfig.GetSection("SpanMeasuredActivityNames").Get<IDictionary<string, bool>>() ?? new Dictionary<string, bool>();
    var metricSpecificActivities = diginsightConfig.GetSection("MetricSpecificSpanMeasuredActivityNames").Get<MetricRecordingNameBasedFilterOptions[]>() ?? Array.Empty<MetricRecordingNameBasedFilterOptions>();
    logger.LogDebug("Found {Count} metric-specific activity configurations", metricSpecificActivities.Length);

    var defaultMetricTags = diginsightConfig.GetSection("MetricTags").Get<string[]>() ?? Array.Empty<string>();
    logger.LogDebug("Default MetricTags: {Tags}", string.Join(", ", defaultMetricTags));
    var metricSpecificTags = diginsightConfig.GetSection("MetricSpecificTags").Get<MetricRecordingEnricherOptions[]>() ?? Array.Empty<MetricRecordingEnricherOptions>();
    logger.LogDebug("Found {Count} metric-specific tag configurations", metricSpecificTags.Length);

    var metricNames = new[] { "diginsight.span_duration", "diginsight.query_cost", "diginsight.request_size", "diginsight.response_size" };
    foreach (var metricName in metricNames)
    {
        // named configuration including metric specific activities
        services.Configure<MetricRecordingNameBasedFilterOptions>(metricName, options =>
        {
            options.MetricName = metricName;

            var activitiesToUse = new Dictionary<string, bool>(defaultMetricActivities);
            var metricConfig = metricSpecificActivities?.FirstOrDefault(m => m.MetricName == options.MetricName);
            if (metricConfig != null) { activitiesToUse.AddRange(metricConfig.ActivityNames); }
            options.ActivityNames = activitiesToUse;
        });
        // named configuration including metric specific tags
        services.Configure<MetricRecordingEnricherOptions>(metricName, options =>
        {
            options.MetricName = metricName;

            var tagsToUse = new List<string>(defaultMetricTags);
            var metricConfig = metricSpecificTags?.FirstOrDefault(m => m.MetricName == options.MetricName);
            if (metricConfig != null) { tagsToUse.AddRange(metricConfig.MetricTags); }
            options.MetricTags = tagsToUse;
        });

        // named filter with associated configuration
        services.AddNamedSingleton<IMetricRecordingFilter, MetricRecordingNameBasedFilter>(
            metricName, (sp, key) =>
            {
                var optsions = sp.GetRequiredService<IOptionsMonitor<MetricRecordingNameBasedFilterOptions>>().Get((string)key!);
                var filter = new MetricRecordingNameBasedFilter(optsions);
                return filter;
            }
        );
        // named enricher with associated configuration
        services.AddNamedSingleton<IMetricRecordingEnricher, MetricRecordingTagsEnricher>(metricName, (sp, key) =>
        {
            var optsions = sp.GetRequiredService<IOptionsMonitor<MetricRecordingEnricherOptions>>().Get((string)key!);
            var filter = new MetricRecordingTagsEnricher(optsions);
            return filter;
        });
    }
The code above is taken from
ObservabilityExtensions.AddObservability()method intoDiginsight.Components.Configurationassembly and it is used in all Diginsight Samples, available into the Diginsight.Samples repository.
After the configuration and named services registration, the Recorder class just needs to ensure it retrieves the named service according to the metric name it is recording.
In the snippet below, we can see the SpanDurationMetricRecorder constructor, which retrieves the named services for IMetricRecordingFilter and IMetricRecordingEnricher by means of serviceProvider.GetNamedService<IMetricRecordingFilter>(metricName).
public SpanDurationMetricRecorder(
    IServiceProvider serviceProvider,
    ILogger<SpanDurationMetricRecorder> logger,
    IClassAwareOptionsMonitor<DiginsightActivitiesOptions> activitiesOptionsMonitor,
    IMeterFactory meterFactory
)
{
    this.logger = logger;
    this.activitiesOptionsMonitor = activitiesOptionsMonitor;
    this.meterFactory = meterFactory;

    IDiginsightActivitiesMetricOptions activitiesOptions = activitiesOptionsMonitor.CurrentValue;
    var metricName = activitiesOptions.MetricName;

    // Get metric (delayed) with lazy initialization
    this.lazyMetric = new Lazy<Histogram<double>>(() => {
        IDiginsightActivitiesMetricOptions options = activitiesOptionsMonitor.CurrentValue;
        return meterFactory.Create(options.MeterName)
                            .CreateHistogram<double>(options.MetricName, options.MetricUnit ?? "ms", options.MetricDescription);
    });

    var metricFilter = serviceProvider.GetNamedService<IMetricRecordingFilter>(metricName);
    this.metricFilter = metricFilter ?? serviceProvider.GetRequiredService<IMetricRecordingFilter>();

    var metricEnricher = serviceProvider.GetNamedService<IMetricRecordingEnricher>(metricName);
    this.metricEnricher = metricEnricher ?? serviceProvider.GetRequiredService<IMetricRecordingEnricher>();
After dependencies registration is complete AddSpanDurationMetricRecorder can be called to register the real SpanDurationMetricRecorder service.
services.AddSpanDurationMetricRecorder(); Summary
Diginsight transforms metrics collection from a manual, error-prone process into an automatic, configurable system that provides immediate value with minimal effort.
Key Benefits:
- Zero-code metrics: Get essential performance metrics without instrumentation code
- Production-ready: Built-in error handling and performance optimizations
- Business-aware: Rich tagging enables filtering by business dimensions
- Flexible: Fine-grained control over what gets measured and how
Best Practices:
- Start with default settings to get immediate value
- Gradually add business-specific tags as observability needs mature
- Use metric-specific configurations to optimize for different operation types
- Leverage filtering to focus on critical business operations
This approach enables teams to achieve comprehensive observability with minimal development overhead while maintaining the flexibility to evolve their monitoring strategy as applications scale.
References
OpenTelemetry Documentation
- OpenTelemetry Metrics Specification - Official specification for metrics collection and export
- OpenTelemetry .NET Getting Started - Introduction to OpenTelemetry for .NET applications
- OpenTelemetry .NET Metrics - Detailed guide on implementing metrics in .NET
.NET Documentation
- .NET Activity Class - Microsoft documentation for the Activity class used in distributed tracing
- .NET Metrics - Official guide to metrics collection in .NET applications
- Dependency Injection in .NET - Understanding DI patterns used in the configuration system
Observability and Monitoring
- Prometheus Metrics Types - Understanding different types of metrics (counters, gauges, histograms)
- Grafana Dashboards - Creating visualizations for collected metrics
- Application Performance Monitoring Best Practices - Microsoft’s guide to application monitoring
Configuration and Patterns
- Options Pattern in .NET - Understanding the configuration pattern used for metric filtering and enrichment
- Named Services in Dependency Injection - Advanced DI patterns for service registration
Diginsight Related Articles
- Application Observability Concepts - Discusses the principles of observability in applications and the roles of .NET, OpenTelemetry, and Diginsight.